Julian Howard, GAM’s Chief Multi-Asset Investment Strategist, outlines his latest multi-asset views, exploring how US equity markets went on a tear in the third quarter, despite elevated uncertainty and signs of slowdown in the US economy. For investors, predicting the next correction will be challenging but ensuring portfolio diversification less so.
06 October 2025
Review
The MSCI AC World Index delivered yet another robust performance during the third quarter of the year, returning fully 8.0% in local currency terms*. Sterling-based investors would have been particularly relieved as the pound slipped against the US dollar, thus boosting their global equity return further in sterling terms after several months of painful appreciation against the greenback.
Currency observation aside, the message from markets appeared to be that all was well in the world. To a limited extent at least, this was true. The third quarter’s corporate earnings season continued to see blockbuster profits for the leading lights in the artificial intelligence (AI) charge, including of course Nvidia which, towards the end of the review period announced a massive USD 100 billion investment in OpenAI1 to build higher capacity data centres. But ‘traditional’ tech businesses also fared well, with Meta and Alphabet reporting strong revenues from their online advertising units, and the latter also seeing strong growth in cloud computing. However, this is where the obvious cheer ends. The US labour market started to display signs of weakness during the quarter. Job additions in July were just 79,000 and for August just 22,000, well below the 100,000* that economists broadly agree is needed to keep the unemployment rate stable. Accordingly, that rate rose to 4.3% during the review period, up from 4.1% at the end of the second quarter*. At the same time, US inflation stubbornly persisted above the Federal Reserve’s (Fed) 2% target, at fully 2.9%*. As if that wasn’t enough to unnerve consumers whose falling confidence was accurately captured by the University of Michigan’s surveys, the US administration piled the pressure onto the Fed to outright lower interest rates despite the upward pressure in prices. While the Fed did cut rates by 25 basis points (bps) in September*, the White House’s hastily installed new Federal Open Market Committee (FOMC) member Stephen Miran called for an aggressive pathway of no fewer than five interest rate cuts into the year-end2.
Against this uncertain backdrop the gains posted by US equities seem unusually strong. At least some of the difference can be explained by a new breed of retail investor using gamified brokerage apps like Webull, Robinhood and eToro to access and ultimately propel the US stock market onwards. Beyond America, Chinese equities posted strong performance amid a more robust-than-expected export sector, signs that the authorities were intent on dealing with ‘overcapacity’ in state-directed sectors and a re-allocation by investors away from bank deposits into stocks. But in Europe markets made far more modest gains as scepticism mounted over the speed and execution of Germany’s infrastructure and armaments plans, along with subdued export figures in the face of tariff uncertainty. This appeared to hurt the continent’s once-mighty auto industry just as it was struggling with the transition to electrification. So while global equities made good headline progress, it would be fair to say that the underlying market and macroeconomic picture was inconsistent during the quarter.
Chart 1: Stalling – US labour market sees slower job growth, rising unemployment:
From 31 Aug 2020 to 31 Aug 2025
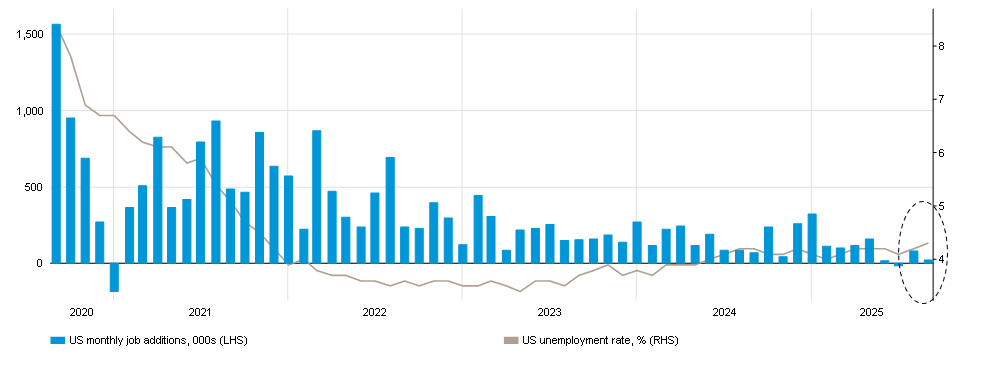
Source: Bloomberg
Past performance is not an indicator of future performance and current or future trends.
Past performance is not an indicator of future performance and current or future trends.
Positioning
Whatever markets bring, our multi-asset portfolios will always remain structurally positioned to capture the superior real returns that global stock markets have historically delivered over time. At the same time, we carefully apply a ‘smoothing element’ in the form of portfolio diversifiers in order to create a range of appropriate risk/return profiles for our diverse client base. The fundamental, super-secular case for stocks as described by Siegel’s Constant remains valid and it therefore makes sense to maintain engagement in equities over time. This does not mean we are oblivious to near-term events that have the potential to send portfolios off-course. Across the equity element in all our multi-asset portfolios we are in the process of neutralising the regional and thematic exposures to better match those of the underlying MSCI AC World Index. This is for the simple reason that uncertainty remains highly elevated across economies and markets and so we revert to a ‘watching mode’ while - importantly - still positioned to participate in equity progress overall. The only deviation to this is in emerging markets where we continue to favour active security selection in this more specialised and less liquid market.
Away from stocks, the focus must of course be on maintaining truly effective and reliable diversification. As such, we are wary of long-dated government bonds which have become sensitive to both rising inflation expectations across key economies as well as the (accurate) perception of out-of-control budget deficits. Instead, our fixed income and credit preferences - major elements of our diversification– are characterised by a variety of approaches including, depending on portfolio: insurance-linked bonds, climate bonds, European sub-investment grade financials, US mortgage-backed securities, medium-dated government bonds and short-dated investment grade credit, government bills and money markets. Taken as a whole, these diverse strategies offer a compelling blend of both yield and diversification so that some return is generated in benign periods, with portfolio protection afforded during more volatile ones. Alternative investments can and do offer further specialised diversification and here highlights would include macro traders, global real estate, long/short opportunistic arbitrage and gold. The latter deserves a particular mention as an effective on-going hedge against increasing global uncertainty and inflation, now trading at over USD 3,800 per oz.* following a rally that began in early 2024. Collectively, our diversification sleeve is therefore designed to facilitate relatively unimpeded participation in global equity markets for clients while offering an effective braking system in the event of volatility or an outright correction.
Chart 2: Bubbling – services dominate US inflation, plus goods are getting pricier now:
Contribution to US CPI from 30 Jun 2015 to 31 Aug 2025
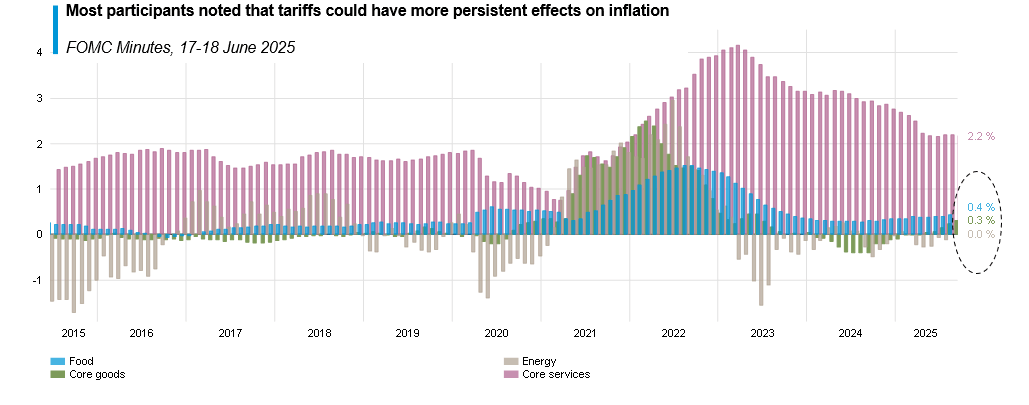
Source: Bloomberg
Past performance is not an indicator of future performance and current or future trends.
Past performance is not an indicator of future performance and current or future trends.
Outlook
As global markets continue their upward trajectory, the disconnect with underlying fundamentals is rapidly turning into a yawning chasm. The problem of course is particularly acute in the US where valuations in the S&P 500 Index are now markedly elevated, with the forward price to earnings ratio exceeding 25x*. Of course, valuation alone is not a prognosticator of near-term market directionality, but it’s another symptom of a market now melting upwards almost without impediment. Boldly predicting the timing of a future correction or even just the next bout of volatility is a sure way to become hostage to fortune, but an educated assessment of where such an event may come from remains a useful thought exercise. The main source of uncertainty surely remains inflation given how the effect of tariffs has not yet fully made its way into the economy, but may be starting to now. The US administration’s insistence on interest rates cuts - presumably to help fund the deficit – therefore represents a particularly alarming policy approach since such cuts would serve only to fuel inflation further.
Another source of risk lies in the profitability profile of corporate America. Data from the St. Louis Fed reveals overall corporate profitability as % of Gross Domestic Product at over 11%3 in the second quarter of 2025, well above the average since 1947 of 7.3%. This raises the bar for further gains in corporate earnings from here. Any signs of faltering in the AI narrative that may represent a threat to future profitability would surely be received poorly by investors. Not unconnected to this is the unknown resilience of the new generation of retail investors who appear to have done much to lower market volatility this year. Work by Vanda Research and the Fed points to about a third of the investor base being retail investors4, which makes them a key deciding factor in the equity market’s fortunes. While their emergence on the scene has a secular feel to it, the app-based investors’ relative youth surely makes them more vulnerable to changing economic circumstances. For example, well-documented rising graduate unemployment in the US could start to leave less money for this cohort to invest after life’s essentials are paid for. Of course, none of this can realistically be timed and, for long-term multi-asset investors, it shouldn’t be anyway. But investor risk profiles do differ and the pure volatility of the equity market is not for everyone (think 2022 and Liberation Day in April this year). This is why diversification is going to matter greatly at some undefined point in the future even where structural engagement in equities is also rightly pursued over time. Portfolio readiness therefore deserves to be uppermost in the conversations between investors and their professional advisers in the coming months, especially while markets are still calm.
Julian Howard is Chief Multi-Asset Investment Strategist at GAM Investments. This article represents the views of GAM’s Multi-Asset team.
Sources:
* Bloomberg, October 2025
1Bloomberg, September 2025
2Reuters, September 2025
3Federal Reserve Bank of St Louis, October 2025
4LPL Research/Vanda Research, July 2025
* Bloomberg, October 2025
1Bloomberg, September 2025
2Reuters, September 2025
3Federal Reserve Bank of St Louis, October 2025
4LPL Research/Vanda Research, July 2025