Steepening yield curves could spell trouble ahead for deficit-addled economies, potentially sooner rather than later. Big-spending governments would do well to heed the warning of soaring long-end yields. For investors, avoiding this value trap in favour of more effective diversifiers could be key, argues Julian Howard.
23 September 2025
Long-dated bonds, sitting in that usually dry and technical corner of capital markets, have been on manoeuvres again. Dramatic spikes in yields (and corresponding drops in prices) over the summer have revealed sovereign bond markets under strain with implications stretching beyond the affected countries’ borders. The UK in particular has been standing out for all the wrong reasons, with the 30-year gilt yield touching nearly 5.7%* on 2 September as bond investors shunned the idea of lending to Britain for the long term. While the declinist UK narrative is all too easy to subscribe to, what’s happening to UK gilts has been mirrored elsewhere too. On the same day, US 30-year Treasuries were close to 5%, Germany’s 30-year bund yields close to 3.5% and Japan’s equivalent was well over 3.0%*. For investors, these higher long-dated yields matter greatly. The economy and consumer are affected because mortgages rates tend to price off longer term yields, affecting the housing market. Companies are affected because longer-term corporate borrowing rates are priced off the ‘risk-free’ long-term borrowing rate as a starting point, even before default risk is priced in. A country’s ability to finance its deficits is also directly affected by the yields on the longer-dated debt it issues, creating uncertainty about tax and spend decisions. And last but not least, higher long-term interest rates affect stock prices which implicitly use interest rates to discount firms’ future earnings streams to come up with a present value.
Paying the price of sustained fiscal fumbles
So what is the root cause of all this? It is of course fiscal distress which has upset all these economies’ bond markets by putting off long term lenders to their respective governments. Starting with the US, despite its privileged status as issue of the world’s reserve currency, it’s not immune to the changing (read worsening) dynamics of its fiscal position. In America, annual federal interest payments have quadrupled since the 2008 financial crisis and now even exceed defence spending while the total debt burden relative to Gross Domestic Product (GDP) has doubled over the same period. The US budget balance is now over -6% of GDP* in the red. In the UK, a gaping fiscal hole of £20-51 billion* (depending on who you ask) has been dominating headlines for weeks, with the Labour government floating a swathe of potential tax rises through the press to see which might be the least unacceptable for an economy whose tax burden is already the heaviest since the War. Europe may house fiscally strict (until now) Germany but in France the government is broke, the government is about to collapse and there is even talk of an IMF rescue. This would be a humiliating prospect which Britons of a certain age will remember from 49 years ago. Japan meanwhile (in)famously carries a debt burden of over 200% of GDP*. The journey to this sorry place deserves its own volume but it can be briefly summarised as due to ageing populations, correspondingly shrinking workforces and increasing entitlements over time, as well as bailouts and transfer payments made in response to successive crises including the 2008 global financial crisis and the 2020 Covid-19 panic.
Deficit attention disorder – US government over-spend has been a feature since the 1970s:
From 31 Dec 1968 to 31 Jul 2025
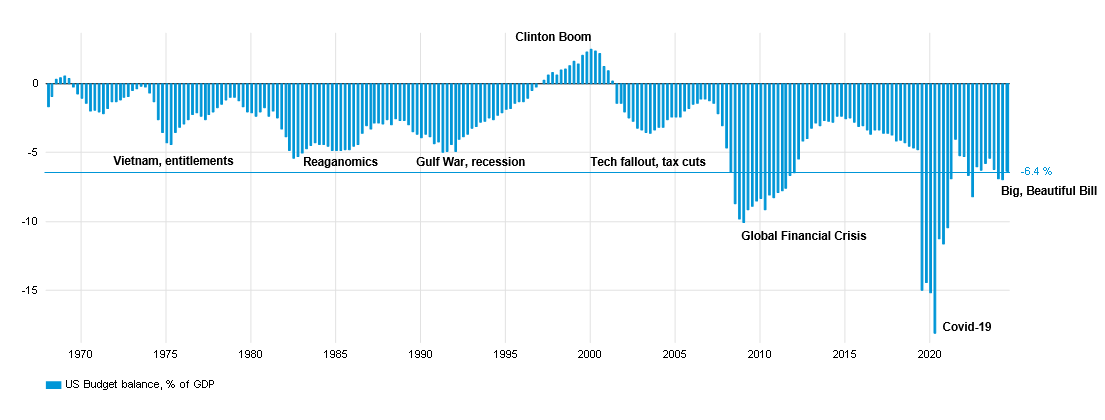
Source: Bloomberg
Past performance is not an indicator of future performance and current or future trends.
Past performance is not an indicator of future performance and current or future trends.
Sudden curve ahead: why bond markets are signposting a fiscal reckoning
The question then becomes whether anything can be done about it soon. In theory, central banks could intervene to stabilise bond markets and it’s no surprise that the Trump administration has been pressuring the US Federal Reserve to cut the near-term interest rates it has control over. But the relationship between short-dated and long-dated bonds is not always direct. In the US, just before it began cutting rates last September, 30-year Treasury yields stood at around 4%*. A year later, those same bonds are touching 5%*, despite expectations of further rate cuts. While in most developed economies short-dated rates are controlled by the central bank – or in the case of the US whoever ends up controlling the central bank – longer-dated rates are set by buyers and sellers in a relatively efficient market. This means that while short-term rate reductions can stimulate the economy, they may also stoke inflation fears further down the line, particularly if inflation is already running above the official target as it is in the US and the UK. This is why longer-dated bonds are yielding so much more than short-dated bonds today. In the technical parlance, this is known as a steep yield curve and it’s a signal of dissonance across the bond market. This bifurcation of interest rates is unlikely to relieve pressure on central banks to cut short-term rates anyway, since cutting rates is widely seen as politically easier than raising unpopular taxes to deal with deficits. But central banks cannot explicitly support government budgets by keeping rates low else it would mark a shift toward ‘fiscal dominance’ in which monetary policy becomes subservient to sensible fiscal policy, with huge inflationary consequences.
Gilt tripping - long-dated UK bonds move to price in fiscal trouble and future inflation:
From 31 Dec 2021 to 12 Sep 2025
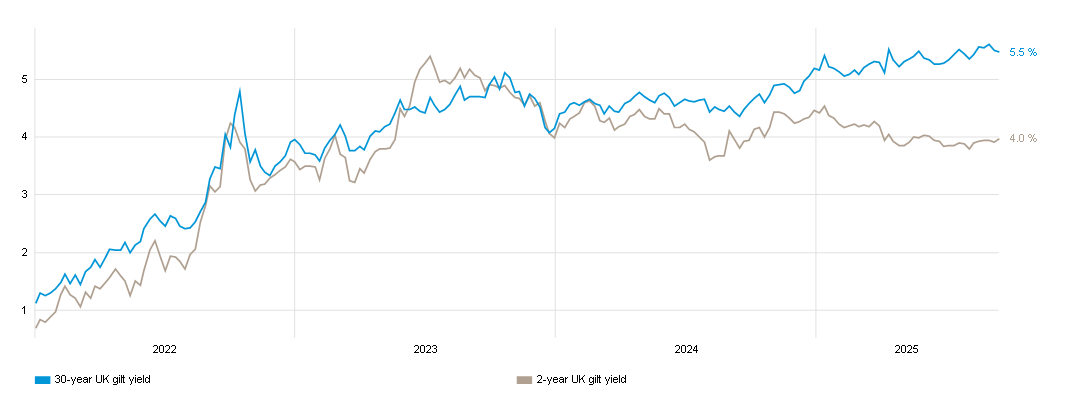
Source: Bloomberg
Past performance is not an indicator of future performance and current or future trends.
Past performance is not an indicator of future performance and current or future trends.
Curve swerve – how effective diversification can smooth portfolios through bond market turbulence
For investors, there are a few immediately actionable insights. The first is probably a healthy avoidance of long maturity government bonds in portfolios. While the current yields on offer look tempting to some, from a portfolio construction perspective, if these so-called risk-free bonds continue to see higher yields (and lower prices) that will undermine the whole point of holding diversification assets which can protect portfolios when stocks fall. The second conclusion concerns those equities which form the backbone of nearly all multi-asset portfolios. Higher bond yields in extremis can hurt stocks as seen in late August and early September when the S&P 500 and Nasdaq-100 in the US and the FTSE 100 in the UK all wobbled partly in response to higher 30-year yields. While any source of volatility is unnerving to investors, the important point is not to attempt to market time equity allocations around fiscal events such as budgetary announcements or bond auctions. It is true that higher interest rates hurt equity prices all other things being equal, but the steepening of the yield curve is in essence pricing in higher inflation expectations for the future. And corporate earnings have over time been adept at riding out inflation, as firms – particularly in the US – are able to pass on most price rises to consumers (see Walmart and Target in recent months). So, while higher rates may present a short-term risk to stocks, well-managed large capitalisation businesses shouldn’t do badly for long given the root cause of those higher rates. This serves to reinforce the vital importance of consistent diversification for smoothing out near term turbulence. Just don’t rely on those troublesome long-dated bonds to provide it.
Julian Howard is Chief Multi-Asset Investment Strategist at GAM Investments.
This article represents the views of GAM’s Multi-Asset team.
* - Source: Bloomberg, September 2025